Confusing correlation with causation: rooster syndrome
| The rooster crows and the sun rises: cause and effect, or red flag? |
How to recognise this tactic
This is the natural human tendency to assume that, if two events or phenomena consistently occur at about the same time, then one is the cause of the other. Hence “rooster syndrome”, from the rooster who believed that his crowing caused the sun to rise.
The invalid assumption that correlation implies cause is probably among the two or three most serious and common errors of human reasoning.
Stephen Jay Gould, American evolutionary biologist and author, 1981
Why do people use this tactic?
We use this tactic on ourselves. We have an evolved tendency to believe in false positives – when event B follows soon after event A, we assume A was the cause of B, even if this is untrue. In evolution, such beliefs are harmless, whereas the belief that A is not the cause of B when it actually is (false negative) can be fatal. Michael Shermer explains: “For example, believing that the rustle in the grass is a dangerous predator when it is only the wind does not cost much, but believing that a dangerous predator is the wind may cost an animal its life.”
Our weakness for this tactic is often exploited by scammers and bogus scientists when they want to persuade us that a relationship exists between two variables without providing supporting evidence.
What’s wrong with this tactic
When two variables, A and B, are found to be correlated, there are several possibilities:
- A causes B
- B causes A
- A causes B at the same time as B causes A (a self-reinforcing system)
- Some third factor causes both A and B
- The correlation is simple coincidence.
It’s wrong to assume any one of these possibilities. Correlation is a strong hint that there may be a relationship, but identifying the exact nature of that relationship requires either controlled experiments or proper statistical analysis, both of which need to be carefully designed. Scientists need to examine all of the variables that may influence the relationship and look for evidence supporting or rejecting the influence of each. They also need to find a mechanism that explains any causal relationship. Only after these steps have been completed can all but one of the possible relationships be eliminated.
What to do when confronted by this tactic
Try to resist the temptation to assume correlation implies causation, and instead look for supporting evidence. Does the correlation occur any more than could be expected by chance (that is, is it simply coincidence)? Have other factors that could be involved in the relationship been examined and ruled out? Is there a plausible mechanism that connects the cause to the effect? If so, has the mechanism been tested and verified?
Variations and related tactics
This tactic is sometimes known as cum hoc ergo propter hoc (Latin for ‘with this, therefore because of this’). It’s the main reason anecdotal evidence is used as a persuasive device – perpetrators try to persuade us of a causal relationship on the basis of a small number of apparent correlations which they demonstrate with anecdotes.
Examples
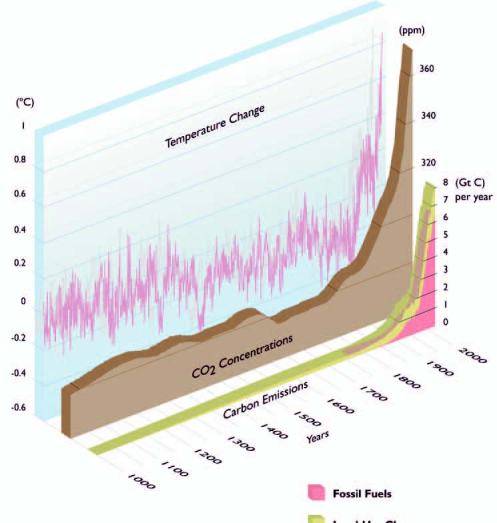
- There is a correlation between global temperatures and atmospheric carbon dioxide concentrations over time, as shown by this graph:
If we knew nothing but the chart, we would know only that fossil fuel emissions, atmospheric CO2, and temperature correlate. That would seem unlikely to represent coincidence, but we would not know which of the three factors might have caused the others. And, as always, we would need to remember that correlation is not causation. But in this case we do know more: we know that burning fossil fuels has put increasing amounts of CO2 into the atmosphere. We know from carbon isotope studies that the increased carbon dioxide in the atmosphere came from fossil fuel combustion rather than from some natural cause. We know that the greenhouse effect, a fact of physics, requires that the more CO2 in the atmosphere, the higher the temperature.
To take the opposite view and deny that the chart shows cause and effect requires one to believe two things for which there is no evidence: first, during the twentieth century, some unknown factor suppressed the greenhouse effect, preventing the increase in carbon dioxide from causing the increase in temperature. … Second, if we grant for the sake of argument that something did suppress the greenhouse effect, then some natural process must have caused the temperature increase. But … scientists have investigated each natural cause of temperature variation – the Sun’s activity, atmospheric ozone, volcanic eruptions, sulfur aerosols – and none by itself or in any combination can explain the twentieth century temperature increase.
- Global warming deniers often point out that, historically, atmospheric carbon dioxide has increased after global temperature rises, not before. They then argue that this proves carbon dioxide cannot cause global warming. In fact, the situation is a classic example of a self-reinforcing system. CO2 causes temperature rises which in turn cause release of CO2 to the atmosphere, and so on…. Past episodes of global warming have indeed mostly been triggered by increases in solar energy. The present episode of global warming has been sparked by increased atmospheric CO2 from burning of fossil fuels. The warming is in turn releasing more CO2, which is reinforcing the warming.
- Here’s an unfortunate example from my local newspaper. A veterinarian treats a traumatised kitten with conventional methods, then resorts to acupuncture. The cat survives, and she ascribes this to the acupuncture. Why wasn’t it the conventional treatment? And why wasn’t it simply a case of reversion to the mean – the animal would have recovered anyway? The only way to tell is to use randomised controlled trials, and these show little evidence that acupuncture is effective.
- Medical researchers from Glasgow University found a correlation between tea-drinking and prostate cancer. However, they did not assume this indicated a causal relationship. In the words of the lead researcher:
Most previous research has shown either no relationship with prostate cancer for black tea or some preventive effect of green tea. We don’t know whether tea itself is a risk factor or if tea drinkers are generally healthier and live to an older age when prostate cancer is more common anyway. We found that heavy tea drinkers were more likely not to be overweight, be non alcohol-drinkers and have healthy cholesterol levels. However, we did adjust for these differences in our analysis and still found that men who drank the most tea were at greater risk of prostate cancer.
- Homes with swimming pools use 49% more energy than homes without. The temptation is to blame the swimming pool for the extra energy. In fact, homes with pools are bigger and have more occupants. Those occupants have higher incomes and a lifestyle geared to high energy consumption. So while the pool accounts for some of the extra energy, it’s a symptom rather than a cause.
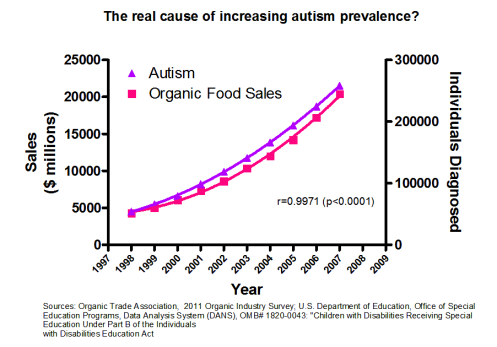
- Update 2014/02/12: Anti-vaccination campaigners vigorously attempt to prove a connection between vaccinations and autism, without any success (because there is none). This graph shows how easy it is to “prove” autism is caused by organic food if you surrender to rooster syndrome.
- Update 2014/05/11: For a selection of graphs that emphatically illustrate the absurdity of rooster syndrome, visit the Spurious Correlations website.
Further reading
Clearing up confusion between correlation and causation at The Conversation.
After This, Therefore Because of This: Your Weird Relationship with Cause and Effect podcast at YANSS.
| This is one of ScienceOrNot’s Science red flags. See them all here. |
Trackbacks & Pingbacks
- Confusing correlation with causation: rooster syndrome | Statistics in the News | Scoop.it
- The bad science checklist of GMO opponents
- Boosting the immune system–sorting science from myth
- Confusion correlation with causation — Mr. LJ's ToK Pages
- Grandma and the Big Oak Tree | janetkwest
- Correlation does not imply causation - Data and Decision Analysis
- Science Red Flags – autisticagainstantivaxxers
- Correlation vs Causation | The Alchemist's Handbook







Thanks Graham. Next time I find myself confronted by this logical fallacy, I shall have the perfect analogy with which to refute it.